24/7 Systems Monitoring
Real-time data visualization supervised by specialist technicians. We ensure proper operation, anticipate failures and generate periodic reports.
24/7 Systems Monitoring
We monitor your infrastructure with professional tools so you're never caught off guard by problems.
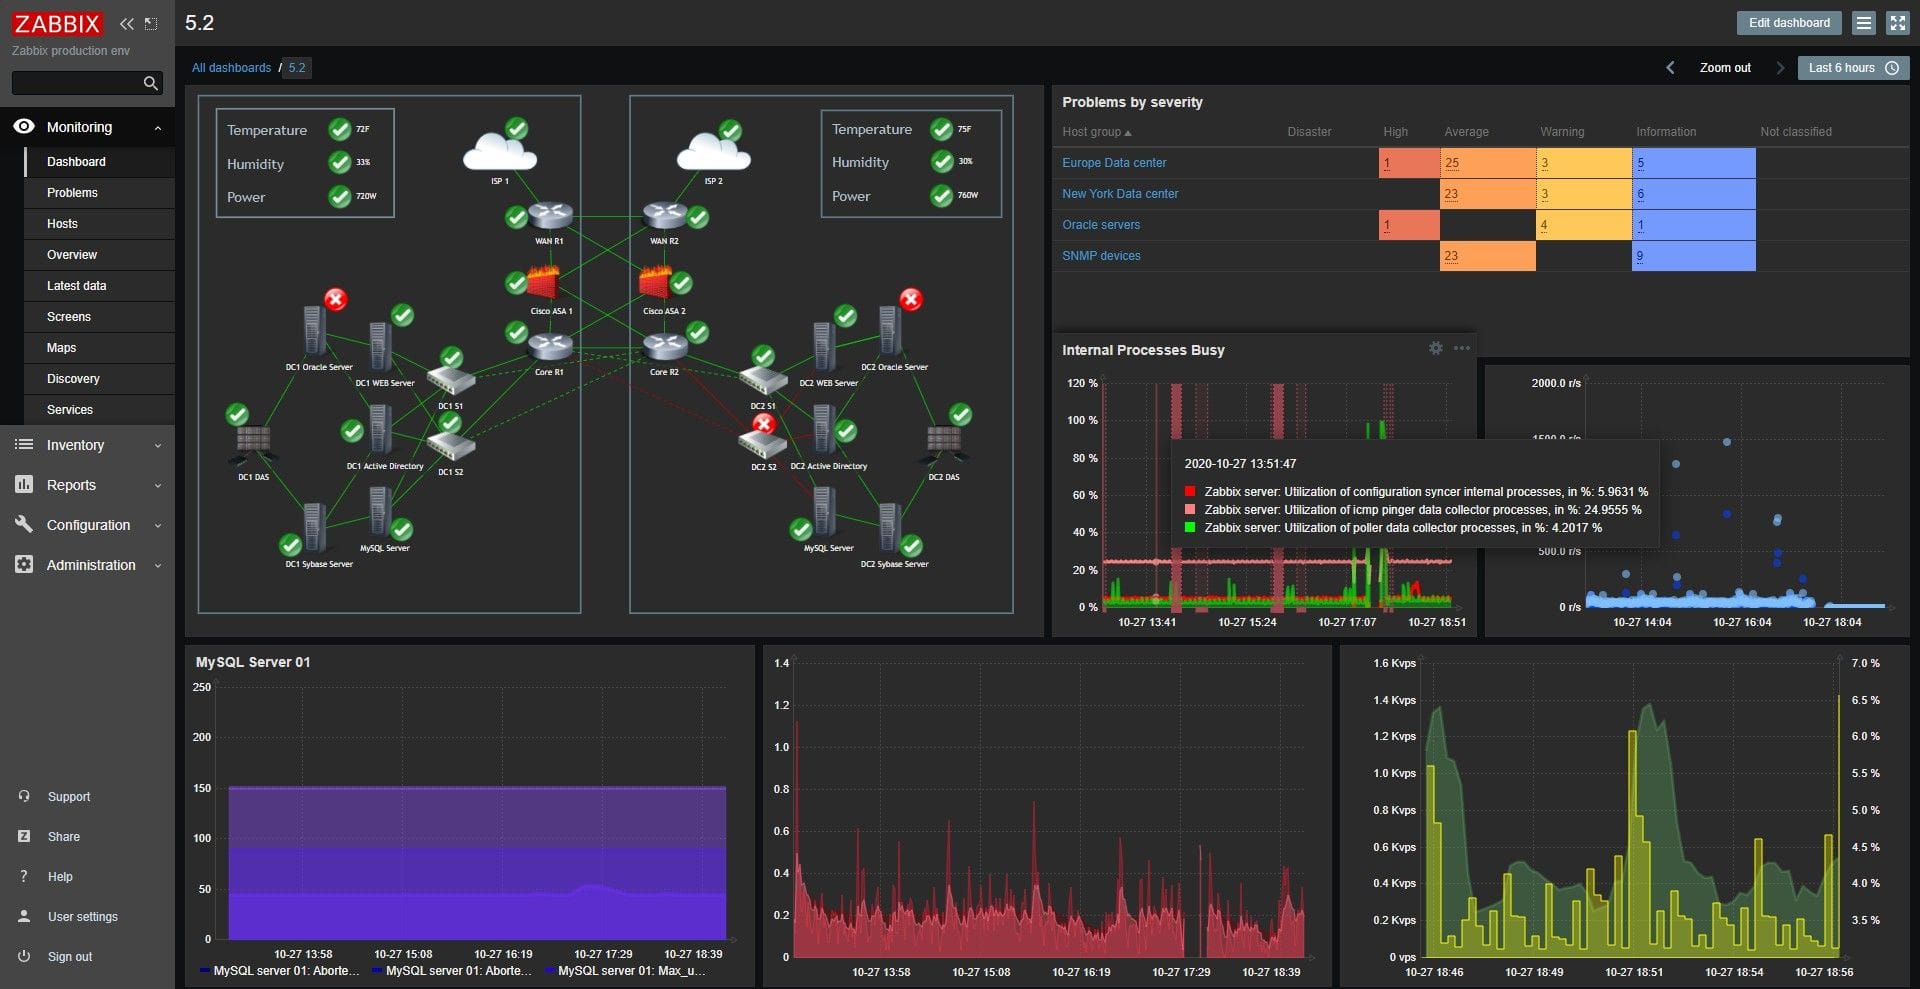
24/7 monitoring with Zabbix
Real-time alerts on CPU, RAM, disk, network and critical services across your entire infrastructure.
- Continuous server and network supervision
- Immediate alerts on anomalies
- Proactive failure detection
Dashboards with Grafana
Clear visualization of your entire infrastructure status in a single accessible and customizable panel.
- Custom panels per service
- Historical and real-time data
- Secure web access for your team
Periodic reports
Status reports for management with trends, key metrics and improvement recommendations.
- Monthly availability reports
- Trend and capacity analysis
- Actionable technical recommendations
Anticipating failures
Proactive monitoring enables detecting problems before they cause downtime. We analyze consumption trends, plan capacity and act before performance degrades. With Zabbix we watch every critical metric of your infrastructure so you can focus on your business.
What we monitor
We cover all elements of your IT infrastructure to guarantee full visibility of the environment.
- Physical and virtual servers (Windows, Linux)
- Workstations and laptops
- Network equipment: switches, routers, Wi-Fi access points
- Printers and peripheral devices
- UPS / uninterruptible power supplies
- Cloud services: Microsoft 365, Azure, AWS
- Critical applications and databases
- SSL certificates and domains
Do you know in real time how your systems are doing?
Request informationFrequently asked questions about systems monitoring
What is Zabbix and why do you use it?
What types of equipment and services can be monitored?
How do I receive alerts when there's a problem?
How much does the monitoring service cost?
Monitor your systems in real time
We'll set up Zabbix and Grafana so you're never caught off guard by a failure again.